YOU'LL NEED THIS PROCESS EXPLORER
A more powerful alternative to the standard Task Manager, Process Explorer is available for free at http://bit.ly/G1ydL.
All my applications a re closed, so why is my PC’s fan suddenly blowing like an asthmatic elephant? Something is driving the processor hard, but what could it be? Have my antivirus defenses been breached? How do I find out what's going on?
Deep at the heart of Windows lies the system scheduler. Easily the most complex and busy part of the operating system, this lump of impenetrable code controls access to system resources. It's the best place to see what's happening and whether it's legitimate. For serious investigation, though, the built-in Task Manager isn't enough. We need something with more precision and scope.
We need the free Process Explorer tool by Mark Russinovich.This Microsoft-supported stand-atone program is exactly what we want to delve safely into the heart of the operating system.-
1 GET STARTED
The first step is to get Process Explorer, which you can find at http://bit.ly/G1ydL. It doesn't need installing, so once you’ve downloaded it, you can easily carry it with you on a USB stick to diagnose problems on other people’s PCs. Click Download and a zip file opens. Create a folder somewhere convenient and drag the rocexp.exe file into it.
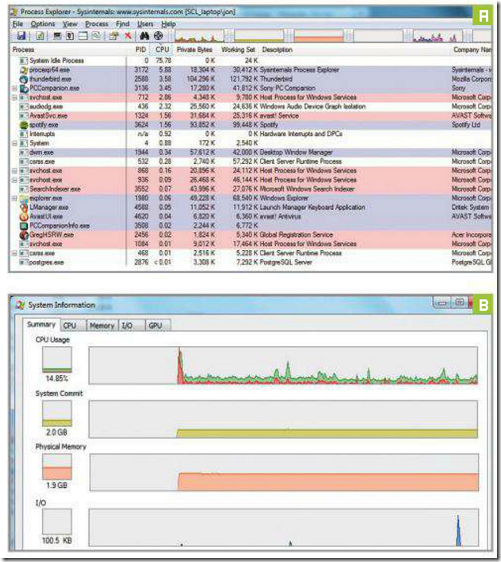
» To get a good look at the system scheduler, we need to run Process Explorer with Administrator rights. To do so, right-click the procexp.exe file and select Run as Administrator. A security pop-up will appear, asking you to confirm your decision. Click Yes and the main Process Explorer interface will appear (image A). Maximize the window to see the most system information.
» Click View > System Information and a window pops up showing current resource use ( mage B). There are several tabs, which give overviews of different parts of the OS and its processing hardware. On multicore systems, you should see multiple traces—one for each core.
2 INVESTIGATE PROCESSES
If CPU use seems high, Process Explorer can tell you which application is hogging it. On the main screen, click CPU and the display sorts itself by the amount of CPU time taken. Processes should pop to the top of the list for a few seconds each. If a process stays at the top, this indicates high CPU use.
Click the Process heading to see which processes are running. Scroll to the bottom of the display to see those started under Explorer—highlighted in pale blue. These are the applications you’re currently using, and the background processes that are started when you log in.
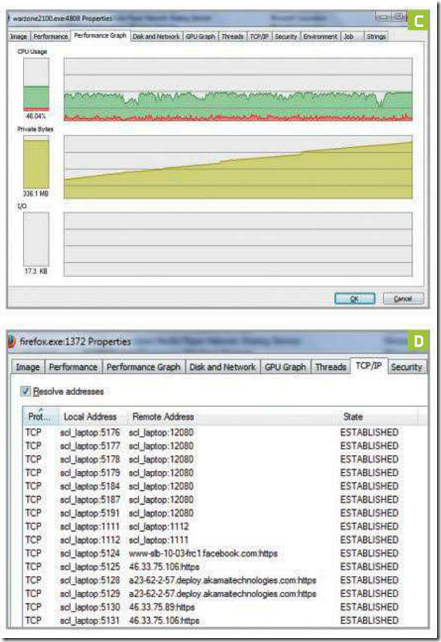
» Right-click a running process and select Properties. This brings up a window containing a detailed view of the process, split into several tabs. The performance graph (image C) is great for telling you if the process is taking too many resources and whether that use is increasing. Steadily mounting memory use might be a sign of memory leakage (taking memory, but not giving it back when finished with it).
» Process Explorer has a handy way of identifying a running process. First, bring the application in question to the front of your desktop. Next, in Process Explorer, drag the target icon at the top of the interface onto the application in question. This temporarily minimizes Process Explorer and displays the application you selected. Drop the icon over the application and its process will be selected in Process Explorer.
» When a new process begins, it can be hard to spot it in Process Explorer's list. To make new processes easier to find, click View > Scroll to New Processes. When a new process begins, the display will then scroll to it and highlight it for you in green. Uncheck the option to switch off this feature when you want a more stable display.
» Some malware connects to the outside world, and we can find out which websites it's linking to. Right-click a process and select Properties. On the resulting window, click the TCP/IP tab (image D). Ensure that the "Resolve addresses" button is ticked and expand the headings to see the websites being connected to. Do they look dodgy? If so, it could be time for a full system scan.
3 TWEAK, KILL, AND RESTART PROCESSES
If you have a game or another demanding application running, you can boost its priority in the system scheduler. To do so, right-click its process and select Set Priority (image E|. Applications are normally set to Normal, but increasing this to Above Normal will increase its availability to the CPU. Don't be tempted to set priority to Realtime or you may lock up the system!
» There’s nothing worse in Windows 7 than a process that suddenly "ghosts out" and the dread words "Not responding" appear in its window title. Instead of simply killing it or waiting for it to die, you can try restarting the process. To do so, find it in Process Explorer, then right- click it and select Restart. This will tell the scheduler to free the process’s resources and start again.
» On a multicore system, a process that uses 100 percent CPU will usually do so using only one core. The others are free to run Process Explorer, so you can still kill the offending code and free up the system to reboot it properly. Right-click the process and select Kill Process. Confirm that you want to kill it and the process will end.
4 EXPLORE OTHER FEATURES
When Process Explorer is running, you’ll see a small graph of CPU use in the system tray of the Windows taskbar. You can add other graphs here for handy reference by clicking Options > Tray Icons and selecting what you need (image F). Note that these only appear when Process Explorer is running. If you hover the mouse over a graph, you’ll be presented with more details.
» Having delved into your running operating system, it’s very useful to make sure that nothing has tampered with an application’s code. To do so, right-click the application and select Properties. In the Image tab (image G), click the Verify button. If the producer is available, this will compare the .exe with a check code and the word Verified will appear next to the vendor’s name.


0 comments:
Post a Comment